

|
You don't need more storage containers, more shelves, more space.
You need fewer things to store, fewer things to maintain, and fewer things to distract you from what's really important. |
 Photo by Saulo Mohana on Unsplash Do you ever wonder where the time goes when you start looking at your phone? You have a few minutes to sit down and relax so you grab your phone and open up your favorite social media app. The next thing you know an hour has gone by, that laundry still hasn’t folded itself, and the dishes are still on the counter. Do you know what you’re really spending your time on when you look at your phone? Thanks to an app called Rescue Time, I have recently learned what I’m doing and it was enlightening. I first installed it a few months ago and kept checking the app to see my stats. It was a bit confusing at first and I almost gave up and uninstalled it. The app shows color coded usage for either today, the last 7 days, or the last 30 days. Sometimes I would just get the message “waiting for data from your motorola XT1585”. The color coded pie chart and color coded list of apps looked cool but I had no idea what the colors meant. The numbers were scary though. My most used app by far is Waze because of my long commute. Aside from 17 hours of trying to avoid traffic jams, looking at the last 30 days told me that I spent 10 hours on Facebook, and 3 hours texting. This wasn’t that helpful other than to point out to me how much time I wasted on Facebook. I already knew it was too much. The real magic happens when you log into the Rescue Time website. Suddenly you see details and find out what all those colors mean. The basics of it are that there are Categories and Sub-Categories which Rescue Time actually does a pretty good job of figuring out on its own. You can completely customize this by putting apps in whatever Category you choose or adding your own. Then, every app (i.e. Activity) gets assigned a Productivity Score of Very Distracting, Distracting, Neutral, Productive, or Very Productive. This was a little bit of a time investment but once I spent time adjusting all these, the reports and dashboards are more useful. Here are just a couple of screenshots. The first is my monthly dashboard from July where you can see 17% of the time I was on my phone it was on Social Networking. Don’t be too impressed by the large Reference & Learning bar because I categorized Waze under Reference. You can tell Rescue Time to completely ignore an app so I might do that with Waze. 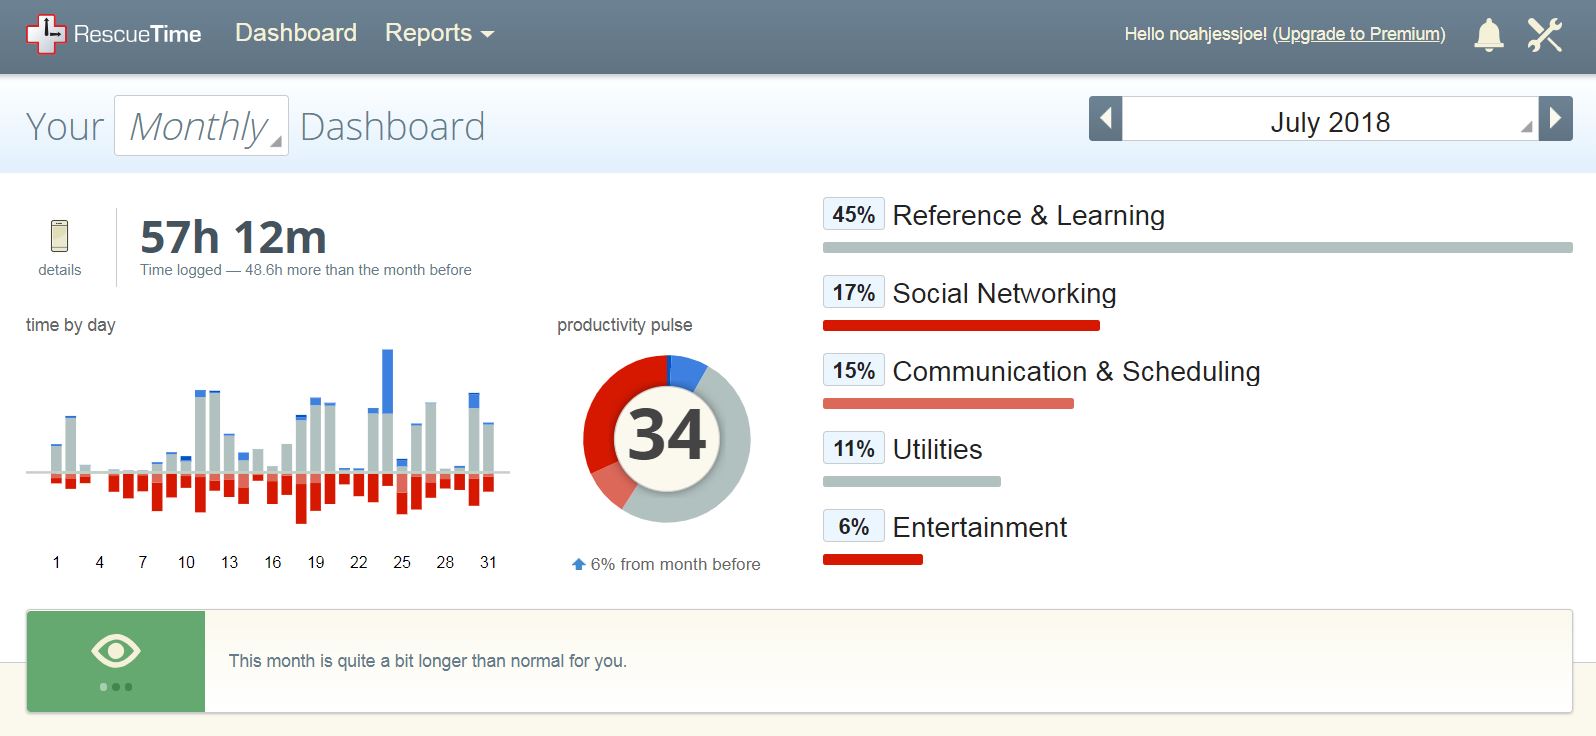 You can see in the next image one of the nice features of Rescue Time. You can drill down in more and more detail. Here is July’s usage by day. You can go further in detail by picking a day to see exactly what time and how long each app was open. 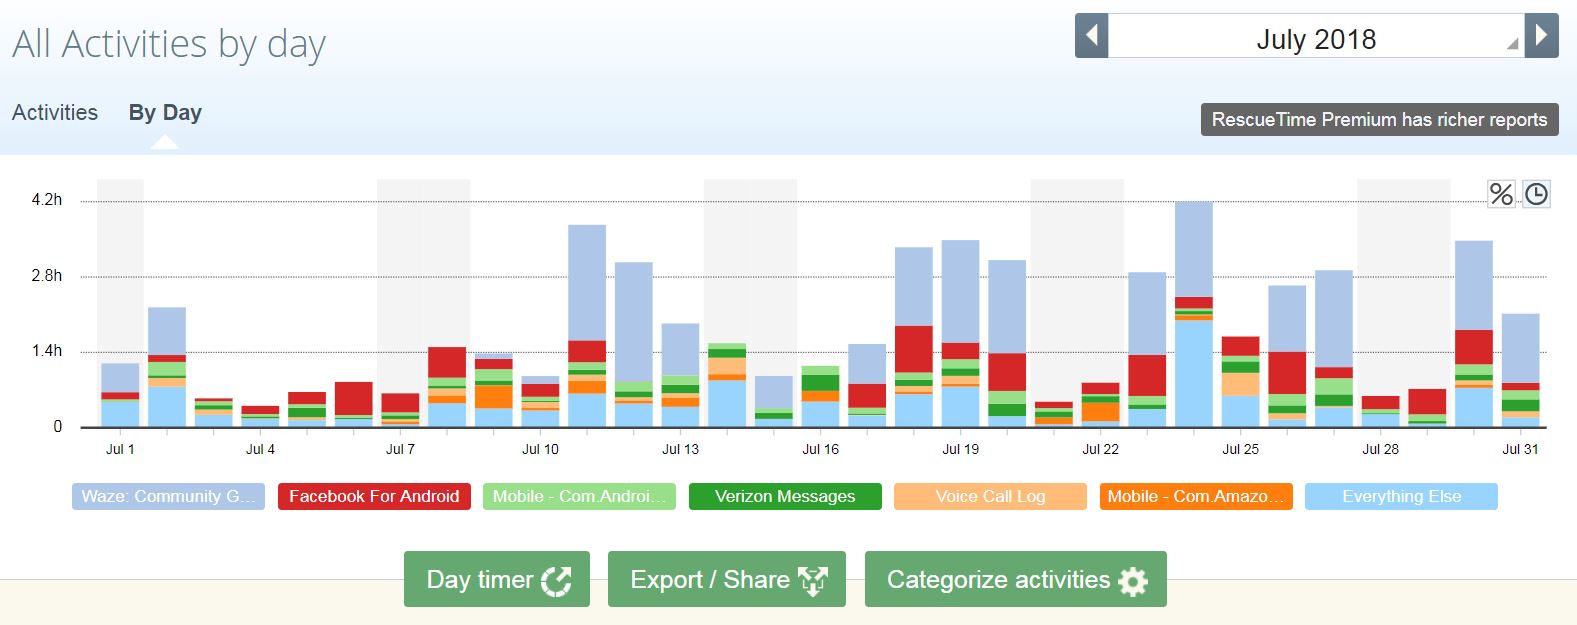 There are many more reports and dashboards available as well as a weekly email report you can sign up for. This is all just the free version too. A Premium plan is available for $72 per year but keep an eye out for deals if you’re interested. You can also install Rescue Time on your Apple, Windows, or Linux computer to track your activities and websites. I haven’t tried this feature out yet but I’m sure the results would be a little depressing. As much as I try, I know I’m not the most productive person when I get a screen in front of me. If you keep finding yourself wondering at the end of the day where in the world your time went, then you need to try out Rescue Time or something like it. Just remember, the data from Rescue Time is only as good as your willingness to to take back your wasted time. Challenge yourself or others by competing for the highest productivity score or at least set some goals for yourself. Pretty graphs aside, you will still need to find your own motivation to remove yourself from the digital world and see what else you're missing out on. |
Categories
All
Copyright Dave Lubke and www.davelubke.com, 2022
|